How to Calculate Historical Interest Rates on Aave
A guide for researchers, borrowers and depositors. Learn how to track DeFi APRs and APYs.
Why Calculate Historical Interest Rates?
If you're lending, borrowing or researching onchain lending platforms like Aave, Morpho or Euler, understanding how to calculate historical interest rates is key to seeing how interest accumulates over time and comparing onchain venues with traditional benchmarks.
Onchain lending rates can be highly volatile, changing every minute, and different approaches to gathering historical data can produce different results. This article explains how to calculate historical lending rates with precision.
Two Ways To Calculate DeFi Interest Rates
1. Use Historical APR Snapshots
A simple method for tracking historical interest rates is to take regular snapshots, daily or hourly, of the APR values quoted by smart contracts such as Aave’s currentVariableBorrowRate and drawnRate.
Snapshot figures represent APRs at specific points in time and can be used to understand broad trends in lending rates. However, these figures can be skewed by volatility between the snapshot timestamps and do not account for intraday fluctuations or compounding effects.
2. Use The Interest Index
A precise method for calculating historical interest rates is to track the growth of the interest index. The interest index is a number that increases continuously to reflect accumulated interest.
By comparing the index values at two different dates, you can calculate the interest that has accrued, i.e. the interest earned or owed, while accounting for compounding and, in some cases, additional sources of income such as flash loan fees.
In Aave V2 and V3, the liquidityIndex tracks deposit interest and the variableBorrowIndex tracks borrow interest. In Aave V4, the analogous measures include the supplied/shares ratio for deposits (similar to ERC-4626 vault assets/shares ratio) and drawnIndex for borrows.
Aavescan Pro datasets include supplyIndex, borrowIndex, supplyApr24h and borrowApr24h. The 24h rates are derived from historical index growth, providing an accurate measure that captures intraday interest fluctuations.
Calculating Interest Rates Using The Index
Compare the index values from two snapshots to calculate the actual interest accrued during that period. This is a precise method for calculating historical interest rates.
// 1. Get supplyIndex values
snapshotNow = currentSnapshot.supplyIndex
snapshot24hAgo = previousSnapshot.supplyIndex

// 2. Compute daily growth
growth = snapshotNow / snapshot24hAgo

// 3. Convert to APR
depositApr = (growth - 1) * 365

// 4. Annualise to APY
depositApy = Math.pow(growth, 365) - 1
This rate reflects the actual interest accrued over the past 24 hours.
Aave Interest Technical Details
The amount of interest earned by lenders and paid by borrowers depends on lending rates, compounding frequency and extra rewards such as flash loan fees.
In Aave V2 and V3, borrow interest compounds every second while deposit interest compounds when the market is updated, typically when users interact with it. Depositors also receive additional yield from flash loan fees.
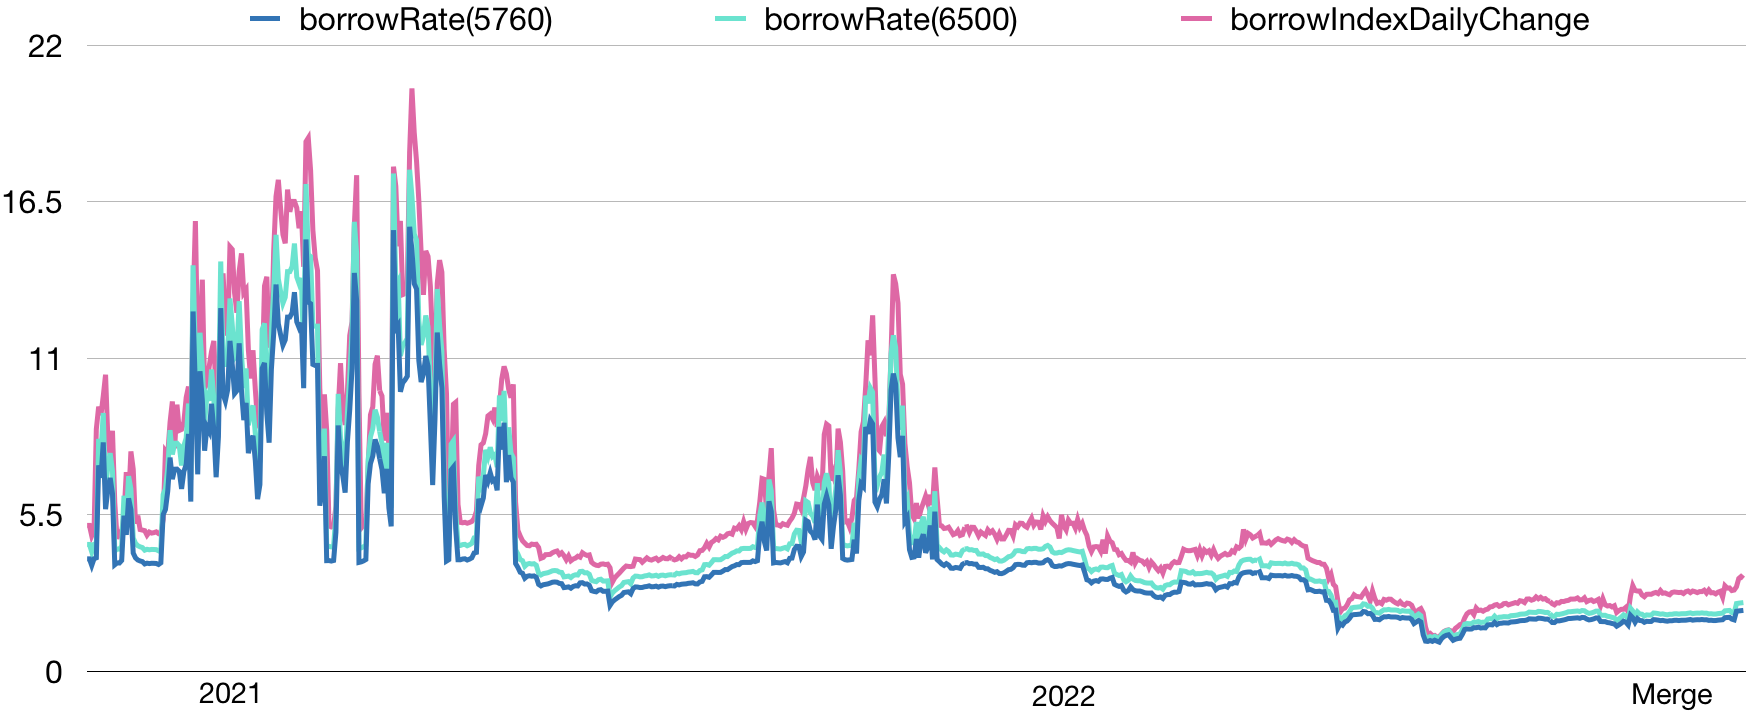
Rates Example
The chart below illustrates how APY calculations can differ depending on how blockchain data is interpreted. This is especially pronounced in Compound V2 market data, where rates are quoted on a per-block basis.
Special thanks to @samlafer for insights in this Twitter thread and to Robert L. in Compound’s Discord.