

 USDC
USDC
USD Coin
Market

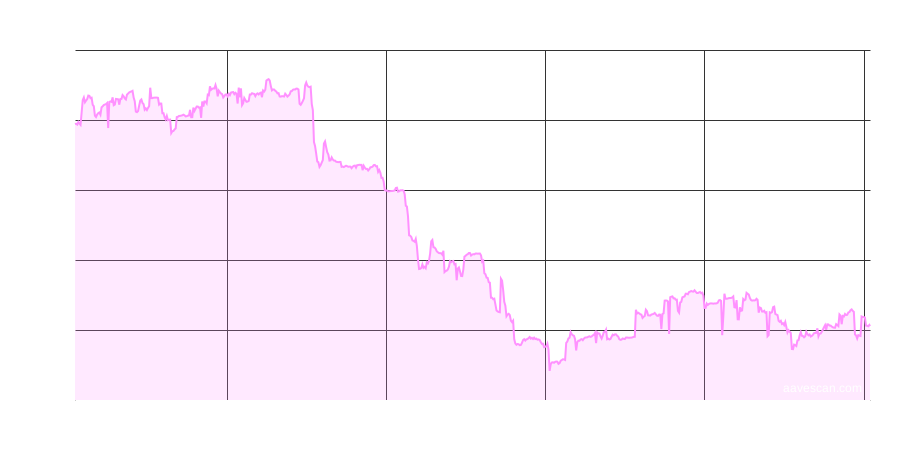
Supply APR
Current interest rate being earned by depositors
2.89%
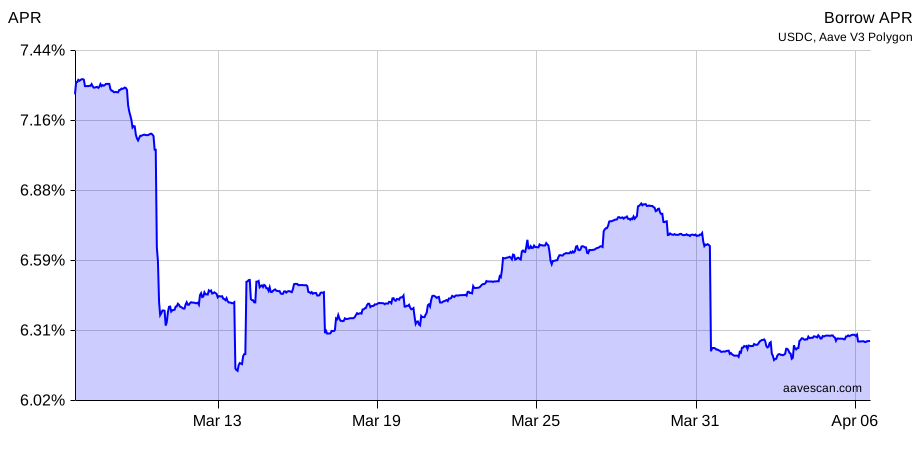
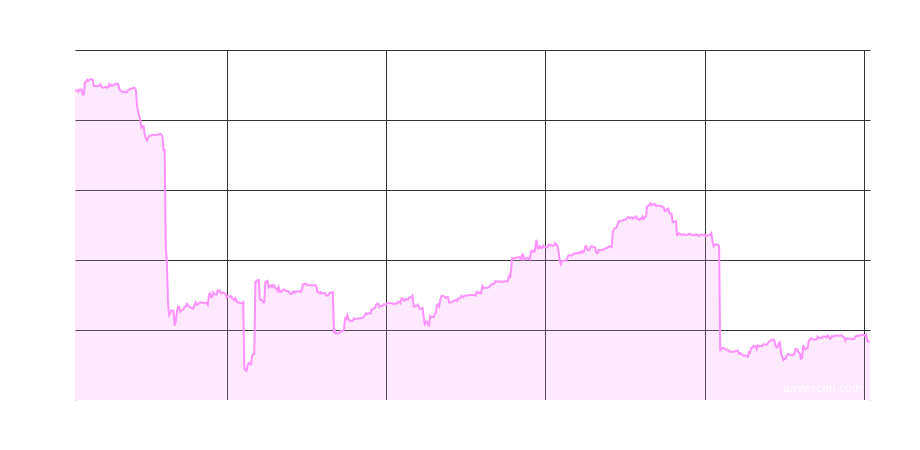
Borrow APR
Current interest rate being paid by borrowers
6.01%
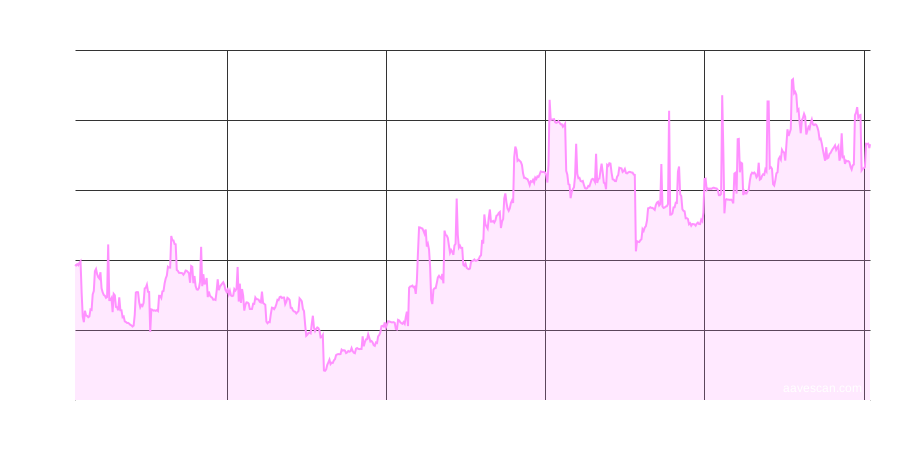
Supplied ($)
Total value currently deposited in USD terms
$29.9M
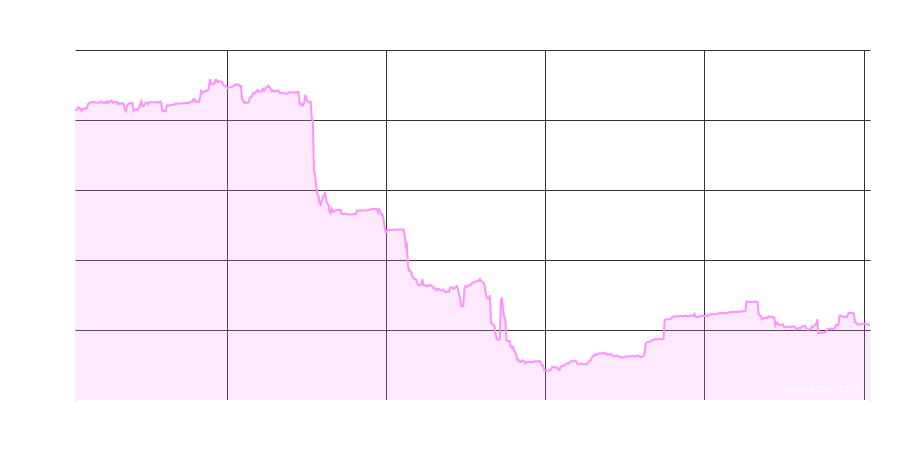
Borrowed ($)
Total value currently borrowed in USD terms
$18.0M
Oracle price
Asset price from market oracle
$1
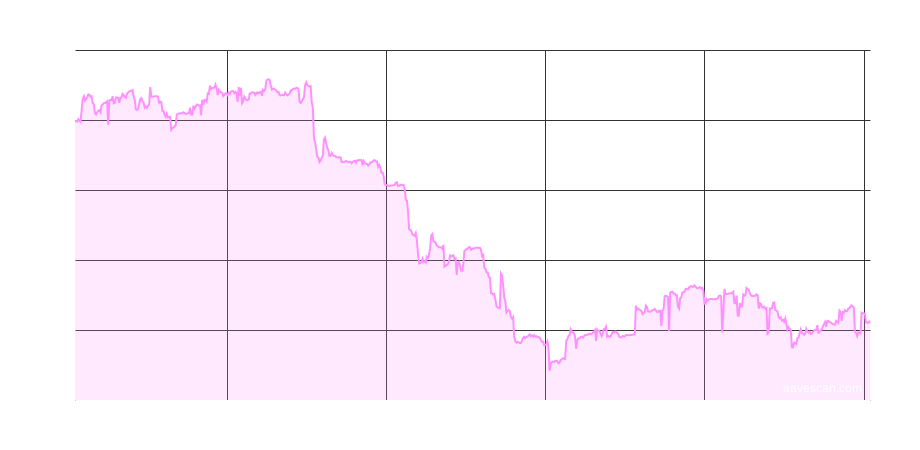
Utilization
Percentage of supplied amount that is borrowed
60.15%
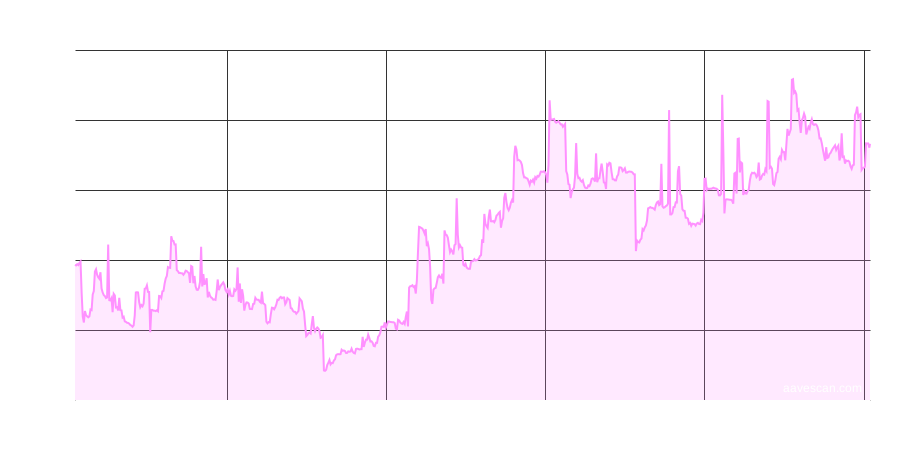
Supplied
29.9M USDC
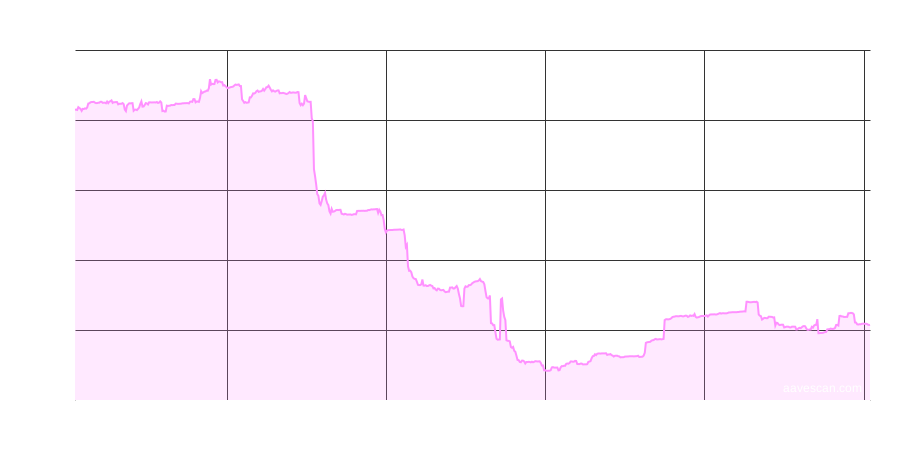
Borrowed
18.0M USDC
Loading...
Download CSV

Get the full USDC dataset
Get the complete history of USDC on Aave V3 Polygon:
- CSV data ready for analysis with Excel, Sheets and Python
- Entire history with daily snapshots from market launch
- Supply & borrow APR, liquidity and utilization
- Index values for precise interest tracking
- Hourly data & API available (Advanced plan)
Customize chart
Color
Brand
Export
Borrow APR


Loading...
Supply APR
Loading...
Supplied ($)
Loading...
Borrowed ($)
Loading...
Utilization
Loading...
Supplied
Loading...
Borrowed
Loading...
Price ($)
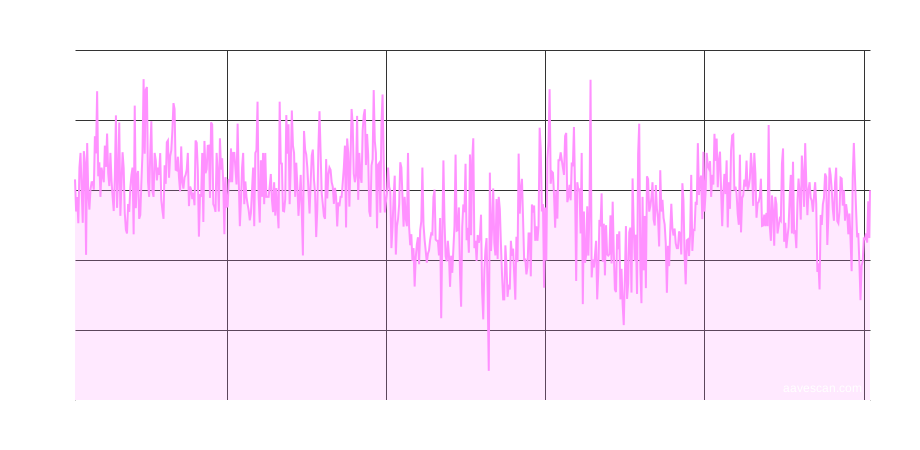
Loading...
Average USDC lending rates
Showing the average APRs over historical periods for USDC on Aave V3 Polygon. Historical incentives not included.
| Rate | 1d | 7d | 30d | 6m | 1y |
|---|---|---|---|---|---|
| Average Supply APR | 2.91% | 2.84% | 2.84% | 2.67% | 2.91% |
| Average Borrow APR | 6.03% | 5.95% | 5.96% | 5.76% | 5.99% |
Daily snapshots
Showing daily snapshots (midnight UTC) for USDC on Aave V3 Polygon. Historical incentives not included.
|
Date
|
Supplied
|
Supply APR
|
Borrowed
|
Borrow APR
|
|---|---|---|---|---|
| Sep 13, 2026 | 29.9M | 2.89% | 18.0M | 6.01% |
| Sep 12, 2026 | 29.9M | 2.90% | 18.0M | 6.02% |
| Sep 11, 2026 | 30.0M | 2.84% | 17.9M | 5.96% |
| Sep 10, 2026 | 29.9M | 2.86% | 17.9M | 5.98% |
| Sep 09, 2026 | 30.1M | 2.82% | 17.9M | 5.93% |
| Sep 08, 2026 | 30.1M | 2.80% | 17.8M | 5.92% |
| Sep 07, 2026 | 30.1M | 2.81% | 17.8M | 5.93% |
Download CSV
Get the full USDC dataset
Get the complete history of USDC on Aave V3 Polygon:
- CSV data ready for analysis with Excel, Sheets and Python
- Entire history with daily snapshots from market launch
- Supply & borrow APR, liquidity and utilization
- Index values for precise interest tracking
- Hourly data & API available (Advanced plan)
Monthly snapshots
Showing monthly snapshots (first day of month, midnight UTC) for USDC on Aave V3 Polygon. Historical incentives not included.
|
Date
|
Supplied
|
Supply APR
|
Borrowed
|
Borrow APR
|
|---|---|---|---|---|
| Sep 01, 2026 | 29.6M | 2.88% | 17.8M | 6.00% |
| Aug 01, 2026 | 30.7M | 2.60% | 17.5M | 5.70% |
| Jul 01, 2026 | 29.6M | 2.78% | 17.5M | 5.90% |
| Jun 01, 2026 | 29.7M | 3.29% | 19.1M | 6.42% |
| May 01, 2026 | 31.8M | 2.78% | 18.8M | 5.90% |
| Apr 01, 2026 | 40.9M | 1.93% | 20.1M | 4.91% |
| Mar 01, 2026 | 40.5M | 2.09% | 20.7M | 5.11% |
| Feb 01, 2026 | 45.4M | 2.55% | 25.6M | 5.65% |
| Jan 01, 2026 | 45.5M | 2.99% | 27.8M | 6.12% |
| Dec 01, 2025 | 44.8M | 3.07% | 27.7M | 6.20% |
| Nov 01, 2025 | 43.5M | 4.05% | 31.0M | 7.12% |
| Oct 01, 2025 | 43.1M | 4.29% | 31.6M | 7.33% |
Download CSV
Get the full USDC dataset
Get the complete history of USDC on Aave V3 Polygon:
- CSV data ready for analysis with Excel, Sheets and Python
- Entire history with daily snapshots from market launch
- Supply & borrow APR, liquidity and utilization
- Index values for precise interest tracking
- Hourly data & API available (Advanced plan)