
 Ethereum
 Plasma
 Arbitrum
 Base
 Mantle
 Monad
 Ink
 BNB
 MegaETH
 Avalanche
 Optimism
 Linea
 Sonic
 X Layer
 Polygon
 Sentora V4
 Arc Core V4
 EtherFi V4

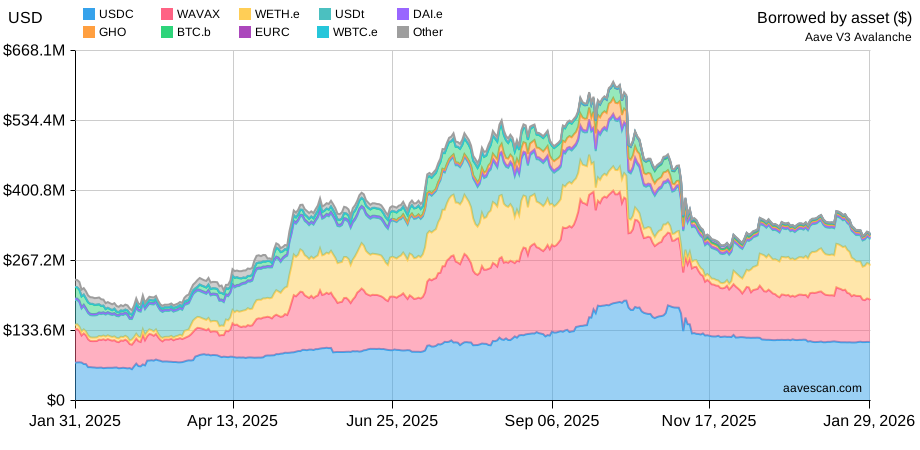
Active loans for Avalanche V3 in USD terms.
Total active loans
$152.0M
Borrow 1d
+$472.9K
Borrow 7d
-$10.2M
Borrow 30d
-$26.0M
Start date
Mar 12, 2022
Loading...
SVG
Upgrade to Pro
View and export full daily history across Aavescan.
- Full daily history across all markets
- Export data as CSV
- APRs, liquidity and utilization
- Hourly data & API available (Advanced plan)
Hourly JSON (30d)

Daily JSON (1y)
Upgrade to Pro
View and export full daily history across Aavescan.
- Full daily history across all markets
- Export data as CSV
- APRs, liquidity and utilization
- Hourly data & API available (Advanced plan)
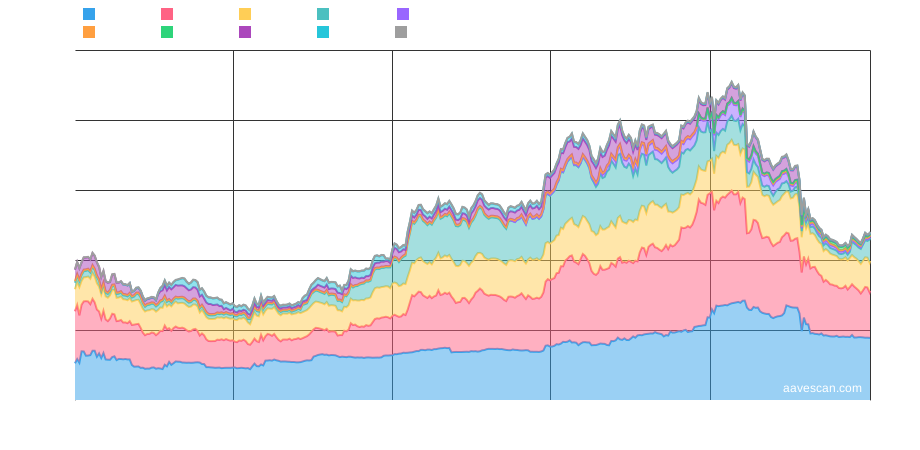
Active loans by asset ($)

Loading...
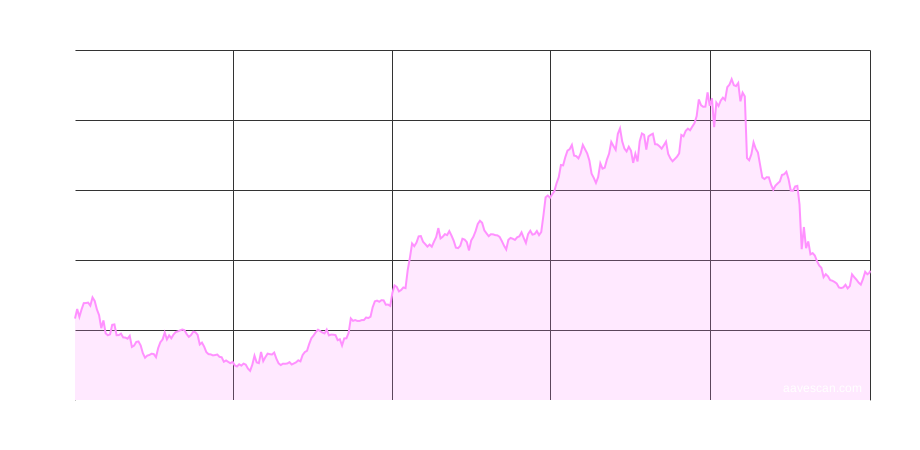
Total active loans ($)
Loading...
Borrow changes
Showing the net USD change in borrow balances on Avalanche V3. USD changes reflect balance changes and price movements.
|
Asset
|
Active loans ($)
|
Active loans 1d
|
Active loans 7d
|
Active loans 30d
|
|---|---|---|---|---|

|
$63.2M | -$1.07M | -$3.43M | +$1.53M |

|
$53.4M | +$1.60M | -$4.60M | -$6.09M |

|
$22.3M | -$116.4K | -$128.8K | -$1.84M |

|
$6.37M | -$7.2K | -$603.0K | -$16.0M |

|
$2.49M | +$69.0K | -$1.42M | -$3.00M |

|
$2.21M | -$3.6K | -$34.5K | -$571.7K |

|
$904.3K | +$216 | +$1.2K | -$35.5K |

|
$816.9K | -$4.4K | +$8.6K | +$26.7K |

|
$147.3K | +$2.4K | -$5.7K | -$7.2K |

|
$117.2K | +$738 | +$1.6K | -$42 |

|
$16.7K | +$551 | -$985 | -$5.7K |

|
$6.7K | +$12 | +$83 | +$328 |

|
$4.3K | +$2.9533 | +$20 | -$137 |

|
$1.4K | +$0.3438 | +$1.2978 | -$2.3K |

|
- | - | - | - |

|
- | - | - | - |

|
- | - | - | - |

|
- | - | - | - |