
 Ethereum
 Plasma
 Arbitrum
 Base
 Mantle
 Monad
 Ink
 BNB
 MegaETH
 Avalanche
 Optimism
 Linea
 Sonic
 X Layer
 Polygon
 Sentora V4
 Arc Core V4
 EtherFi V4

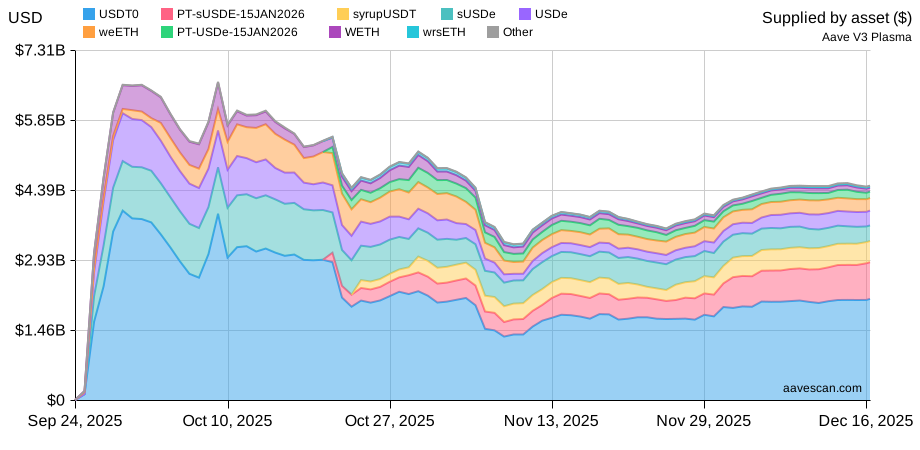
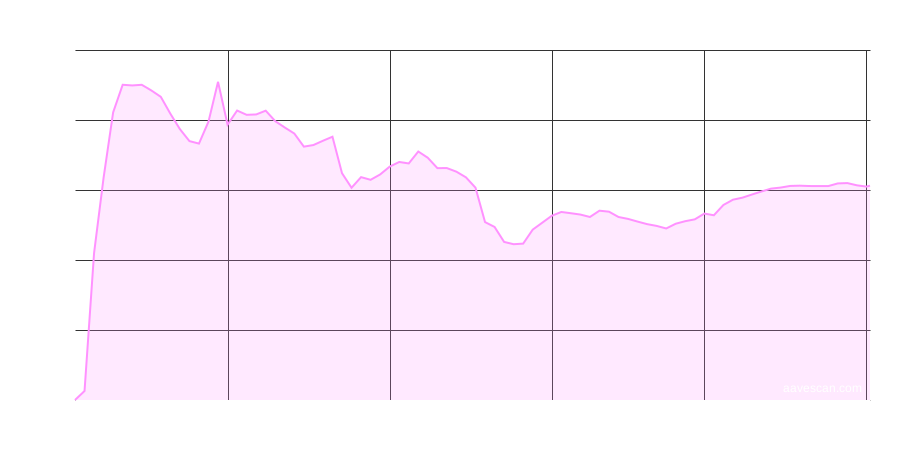
Deposits for Plasma V3 in USD terms.
Total deposits
$1.66B
Supply 1d
-$45.6M
Supply 7d
-$55.4M
Supply 30d
+$12.7M
Start date
Sep 24, 2025
Loading...
SVG
Upgrade to Pro
View and export full daily history across Aavescan.
- Full daily history across all markets
- Export data as CSV
- APRs, liquidity and utilization
- Hourly data & API available (Advanced plan)
Hourly JSON (30d)

Daily JSON (1y)
Upgrade to Pro
View and export full daily history across Aavescan.
- Full daily history across all markets
- Export data as CSV
- APRs, liquidity and utilization
- Hourly data & API available (Advanced plan)
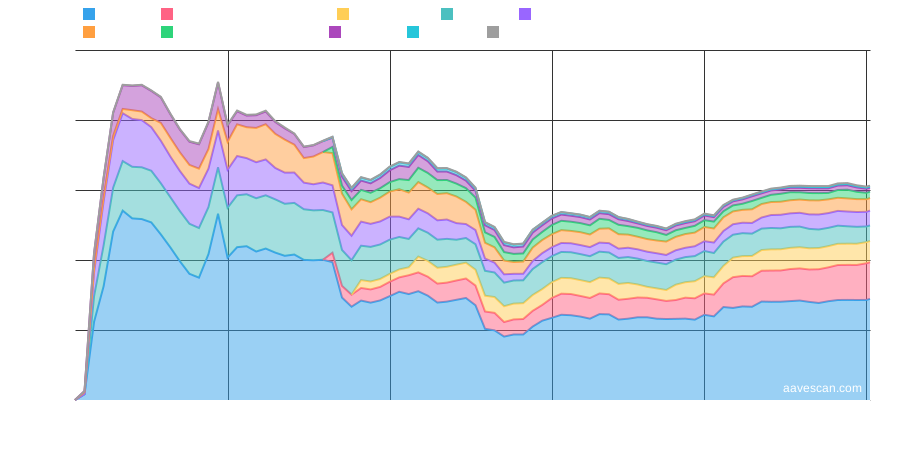
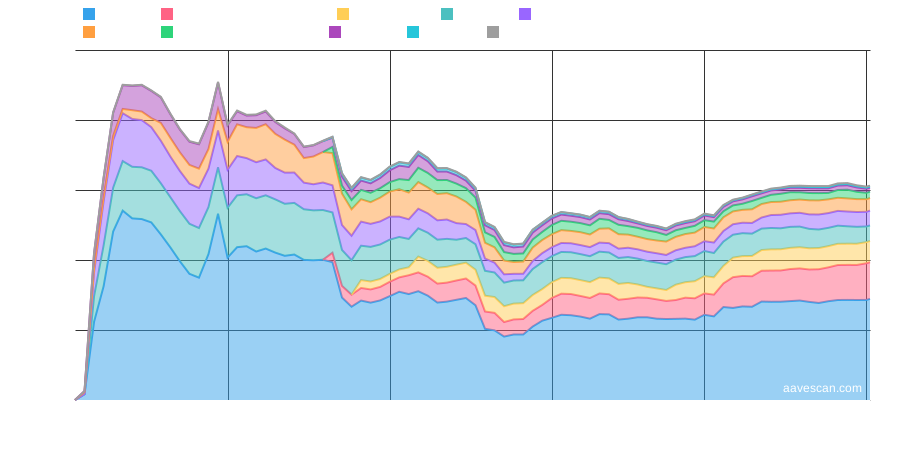
Deposits by asset ($)

Loading...
Total deposits ($)
Loading...
Supply changes
Showing the net USD change in supply balances on Plasma V3. USD changes reflect balance changes and price movements.
|
Asset
|
Deposits ($)
|
Deposits 1d
|
Deposits 7d
|
Deposits 30d
|
|---|---|---|---|---|

|
$779.4M | -$22.5M | -$38.3M | +$18.4M |

|
$613.3M | -$23.3M | +$4.07M | +$55.3M |

|
$183.2M | +$48.4K | +$941.0K | -$26.1M |

|
$57.4M | +$15.2K | +$77.1K | +$20.4M |

|
$21.6M | +$33.0K | +$955.4K | -$2.04M |

|
$2.48M | +$42.5K | -$103.4K | -$338.4K |

|
$972.2K | +$39.1K | -$46.8K | -$373.8K |

|
$684.8K | +$11.8K | -$27.6K | -$107.7K |

|
$423.0K | +$2.2K | -$46.4K | -$84.0K |

|
$108.5K | -$5.7K | -$23.0M | -$52.4M |

|
$10.2K | +$1.3117 | -$3.2002 | -$13 |

|
$1.0K | +$0.1293 | -$0.3153 | -$1.2336 |

|
$537 | +$0.0690 | -$0.1683 | -$21 |

|
$146 | +$0.0187 | -$0.0456 | -$0.1783 |

|
$131 | +$2.2575 | -$5.2853 | -$16 |

|
$100 | +$0.0128 | -$0.0313 | -$0.1224 |

|
$100 | +$0.0128 | -$0.0313 | -$0.1224 |

|
$51 | +$0.8777 | -$2.0580 | -$6.2866 |