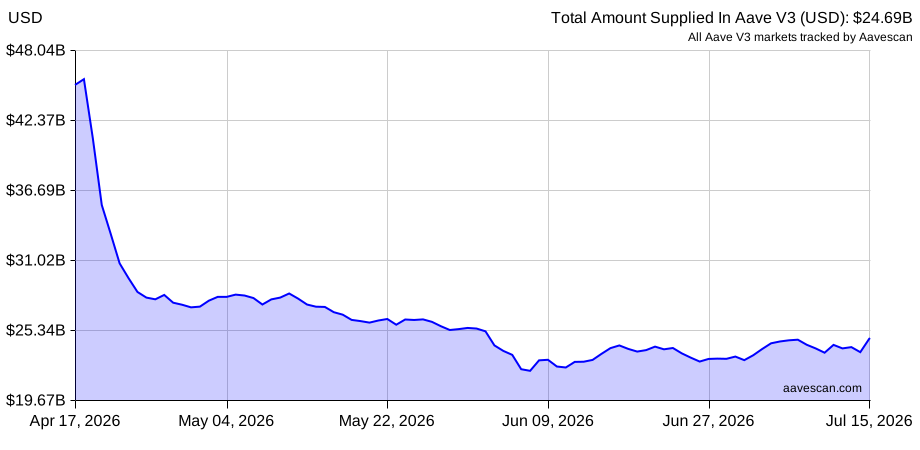
Total Amount Supplied In Aave V3
Loading...
Across Aave V3 markets, supplied has increased 5.21% over the past 30 days, and borrowed has increased 4.81% over the same period.
Showing monthly snapshots (midnight UTC) for total supplied, borrowed, and TVL in Aave V3.
| Date | Supplied | Borrowed | TVL |
|---|---|---|---|
| Current | $24.63B | $10.45B | $14.18B |
| 2026-07-01 | $22.90B | $9.80B | $13.10B |
| 2026-06-01 | $25.46B | $10.64B | $14.83B |
| 2026-05-01 | $27.24B | $12.08B | $15.16B |
| 2026-04-01 | $42.99B | $17.42B | $25.56B |
| 2026-03-01 | $43.38B | $16.76B | $26.62B |
| 2026-02-01 | $51.95B | $22.12B | $29.83B |
| 2026-01-01 | $54.65B | $21.92B | $32.74B |
| 2025-12-01 | $53.31B | $21.22B | $32.10B |
| 2025-11-01 | $63.31B | $25.82B | $37.49B |
| 2025-10-01 | $70.64B | $28.15B | $42.50B |
| 2025-09-01 | $66.41B | $27.91B | $38.50B |
| 2025-08-01 | $57.70B | $24.01B | $33.69B |